Thinking You Should FSBO? Think Again [INFOGRAPHIC]
![Thinking You Should FSBO? Think Again [INFOGRAPHIC] | Simplifying The Market](https://files.keepingcurrentmatters.com/wp-content/uploads/2016/06/20160624-ENG-STM.jpg) Some Highlights:
According to NAR's Profile of Home Buyers & Sellers:
Some Highlights:
According to NAR's Profile of Home Buyers & Sellers:
- 88% of buyers look for their new home online.
- Using a real estate agent can net you $39,000 more than FSBO'ing.
- There is a long list of people that you will have to negotiate with when you decide to sell your home, using an experienced professional can help ease the process.

![Foreclosure Rate Drops to New Post-Crisis Low [INFOGRAPHIC] | Simplifying The Market](https://files.keepingcurrentmatters.com/wp-content/uploads/2016/06/Corelogic-Foreclosure-STM.jpg)
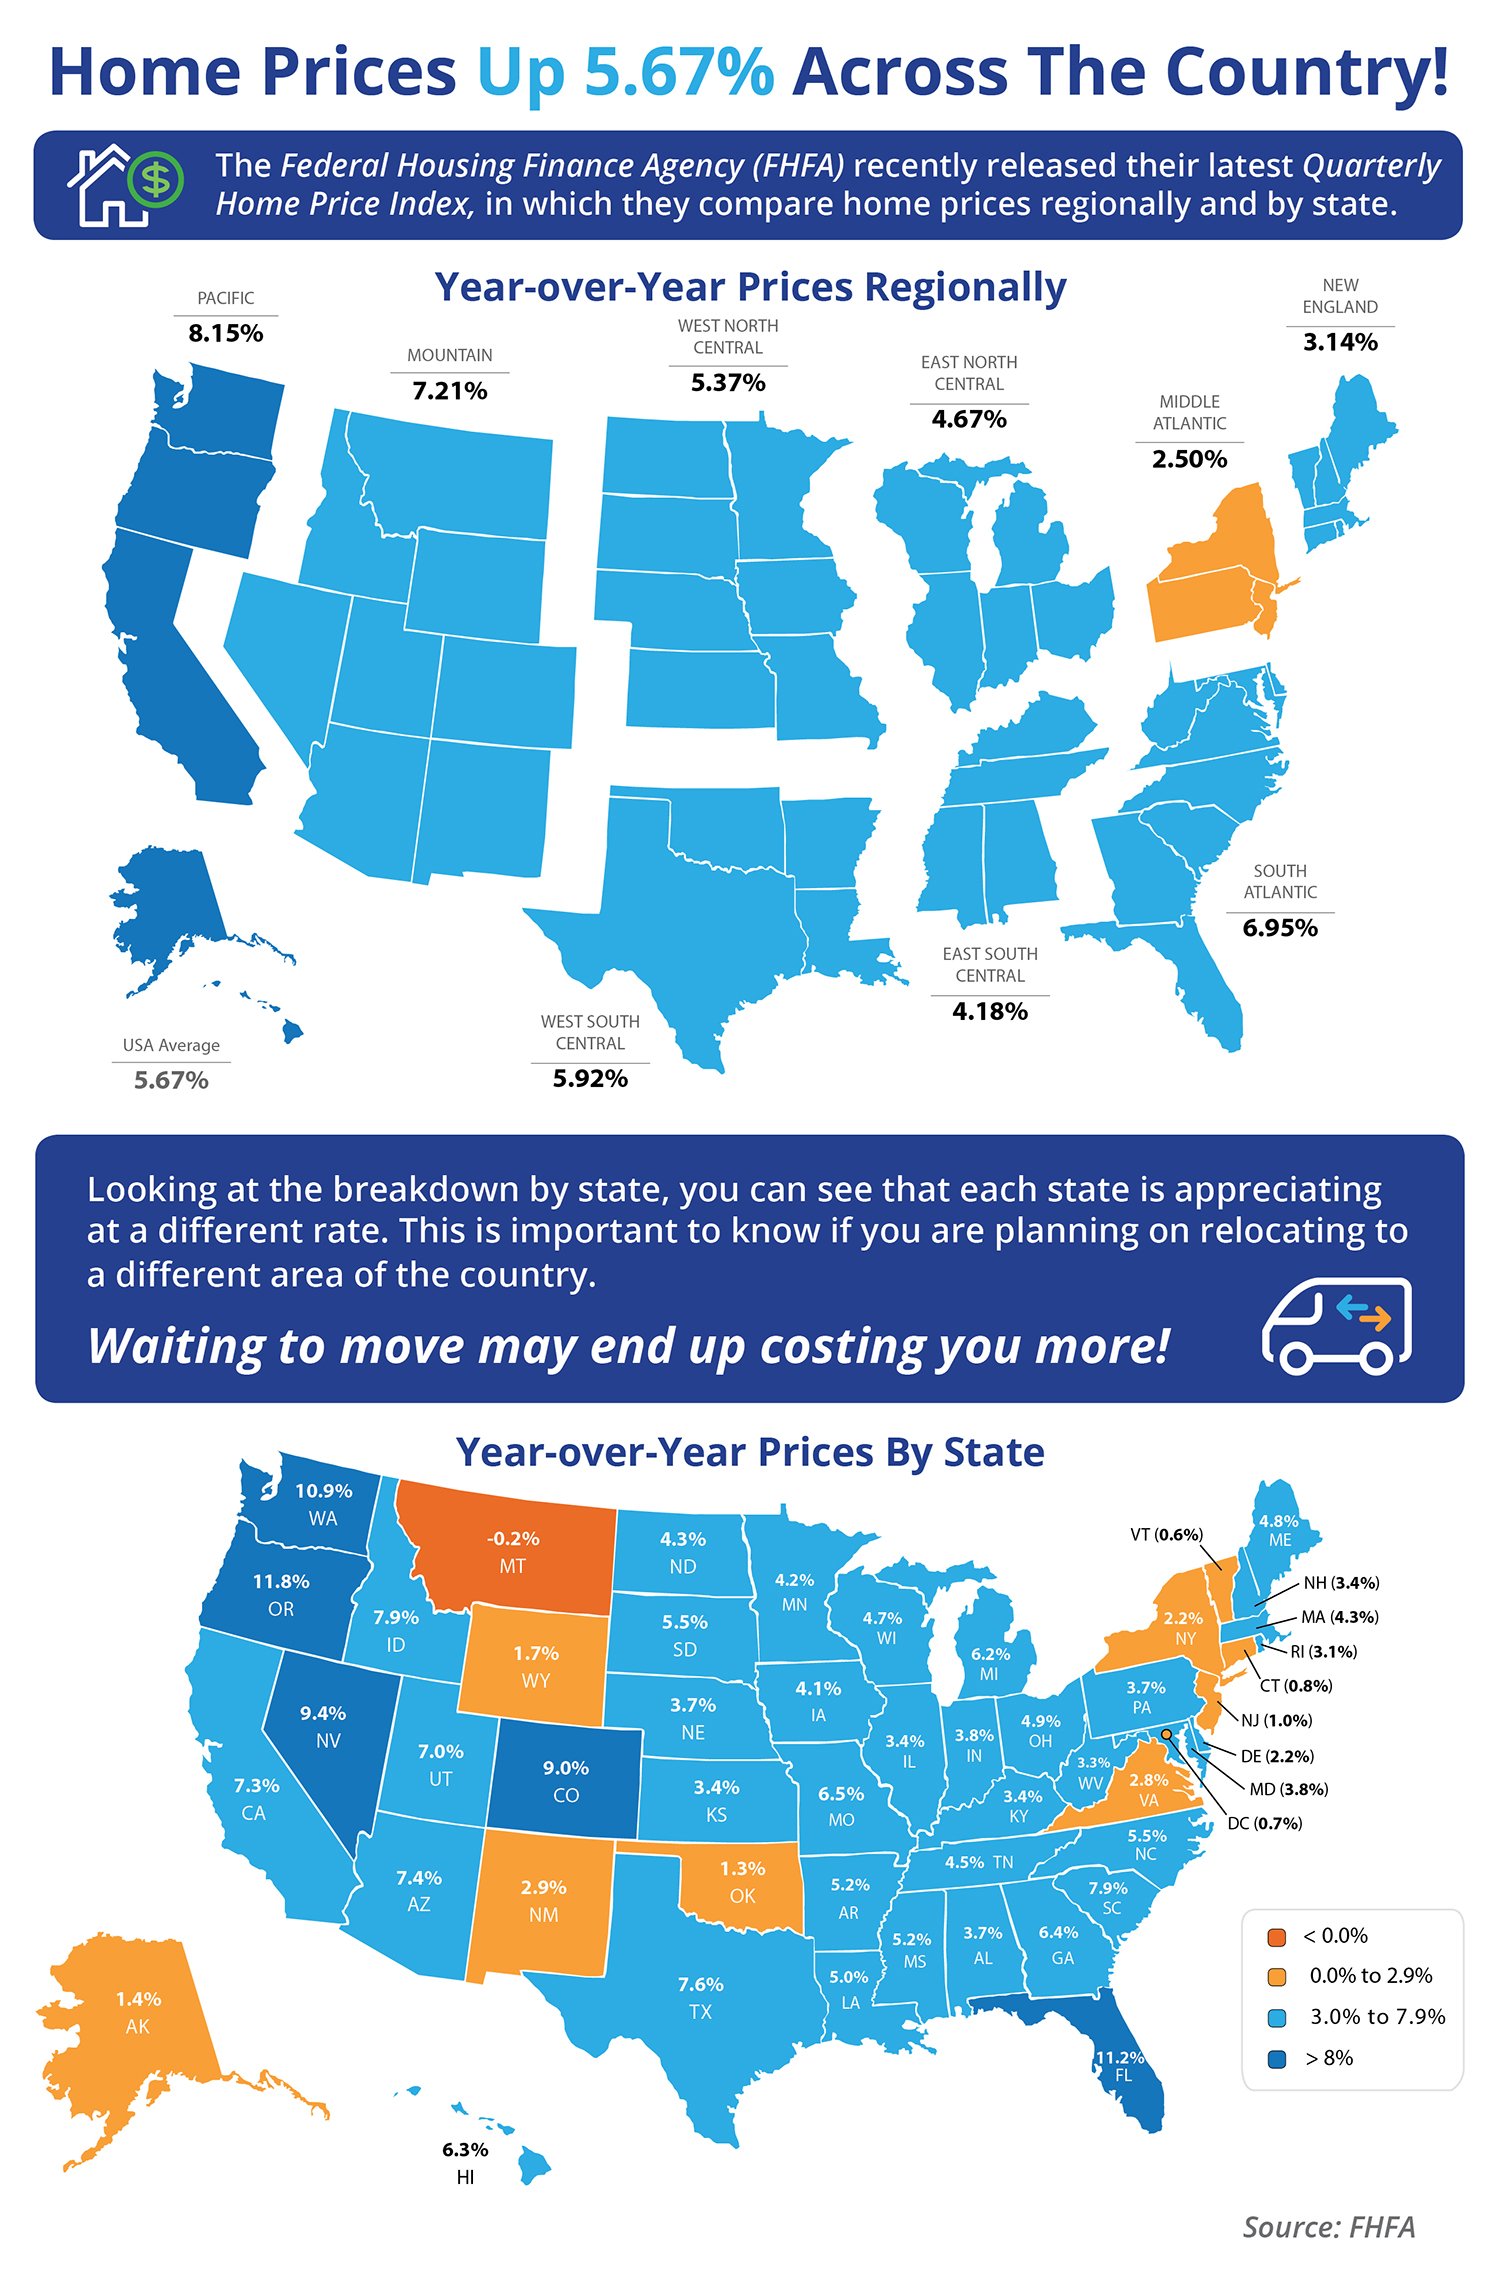

![New & Existing Home Sales Climb [INFOGRAPHIC] | Simplifying The Market](https://files.keepingcurrentmatters.com/wp-content/uploads/2016/05/20160527-EHS-APR-STM.jpg)
![Renting vs. Buying: What Does it Really Cost? [INFOGRAPHIC] | Simplifying The Market](https://files.keepingcurrentmatters.com/wp-content/uploads/2016/05/Rent-vs.-Buy-STM.jpg)
![Housing Market Snapshot [INFOGRAPHIC] | Simplifying The Market](https://files.keepingcurrentmatters.com/wp-content/uploads/2016/05/Housing-Market-Update-STM.jpg)


![New Home Buyers Look For Green Options [INFOGRAPHIC] | Simplifying The Market](https://files.keepingcurrentmatters.com/wp-content/uploads/2016/04/Go-Green-Infographic-STM.jpg)
![Vacation Home Sales Reach 2nd Highest Mark Since 2006 [INFOGRAPHIC] | Simplifying The Market](https://files.keepingcurrentmatters.com/wp-content/uploads/2016/04/Vacation-Homes-STM.jpg)

![Don't Be Fooled... Homeownership Is A Great Investment! [INFOGRAPHIC] | Simplifying The Market](https://files.keepingcurrentmatters.com/wp-content/uploads/2016/03/Dont-Be-Fooled-STM.jpg)
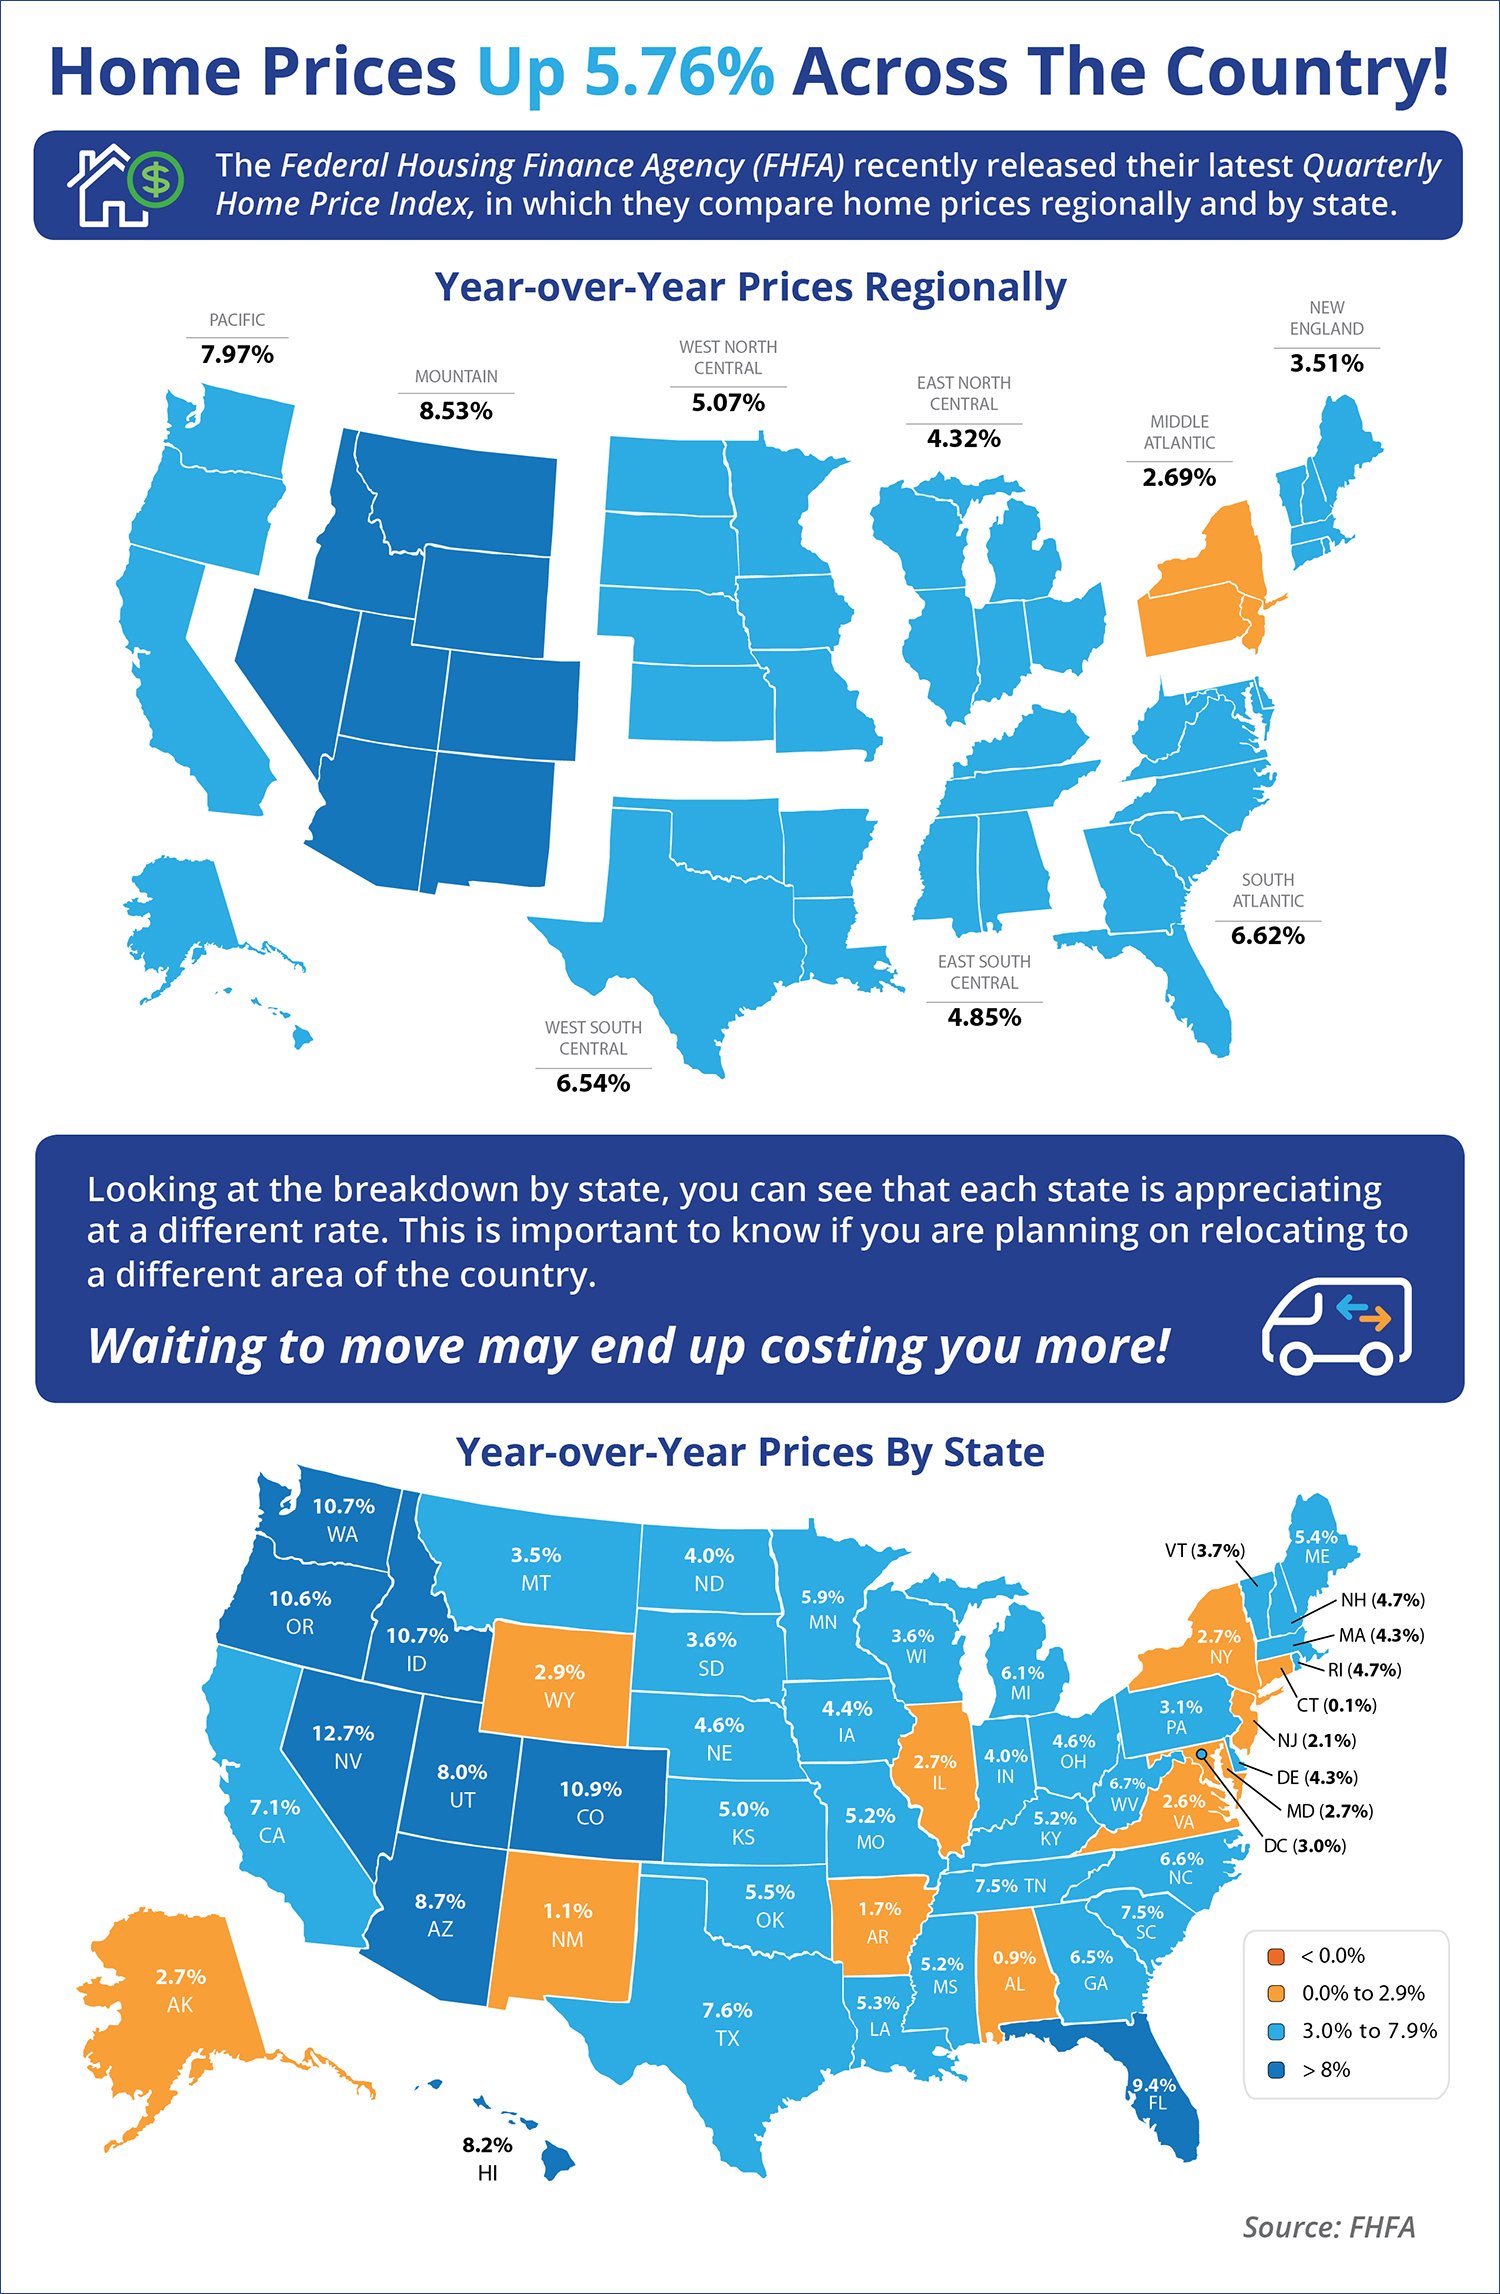
![The Mortgage Process: What You Need To Know [INFOGRAPHIC] | Simplifying The Market](https://files.keepingcurrentmatters.com/wp-content/uploads/2016/03/Mortgage-Process-STM.jpg)
![The Difference An Hour Makes This Spring [INFOGRAPHIC] | Simplifying The Market](https://files.keepingcurrentmatters.com/wp-content/uploads/2016/02/The-Difference-a-Hour-Makes-STM.jpg)
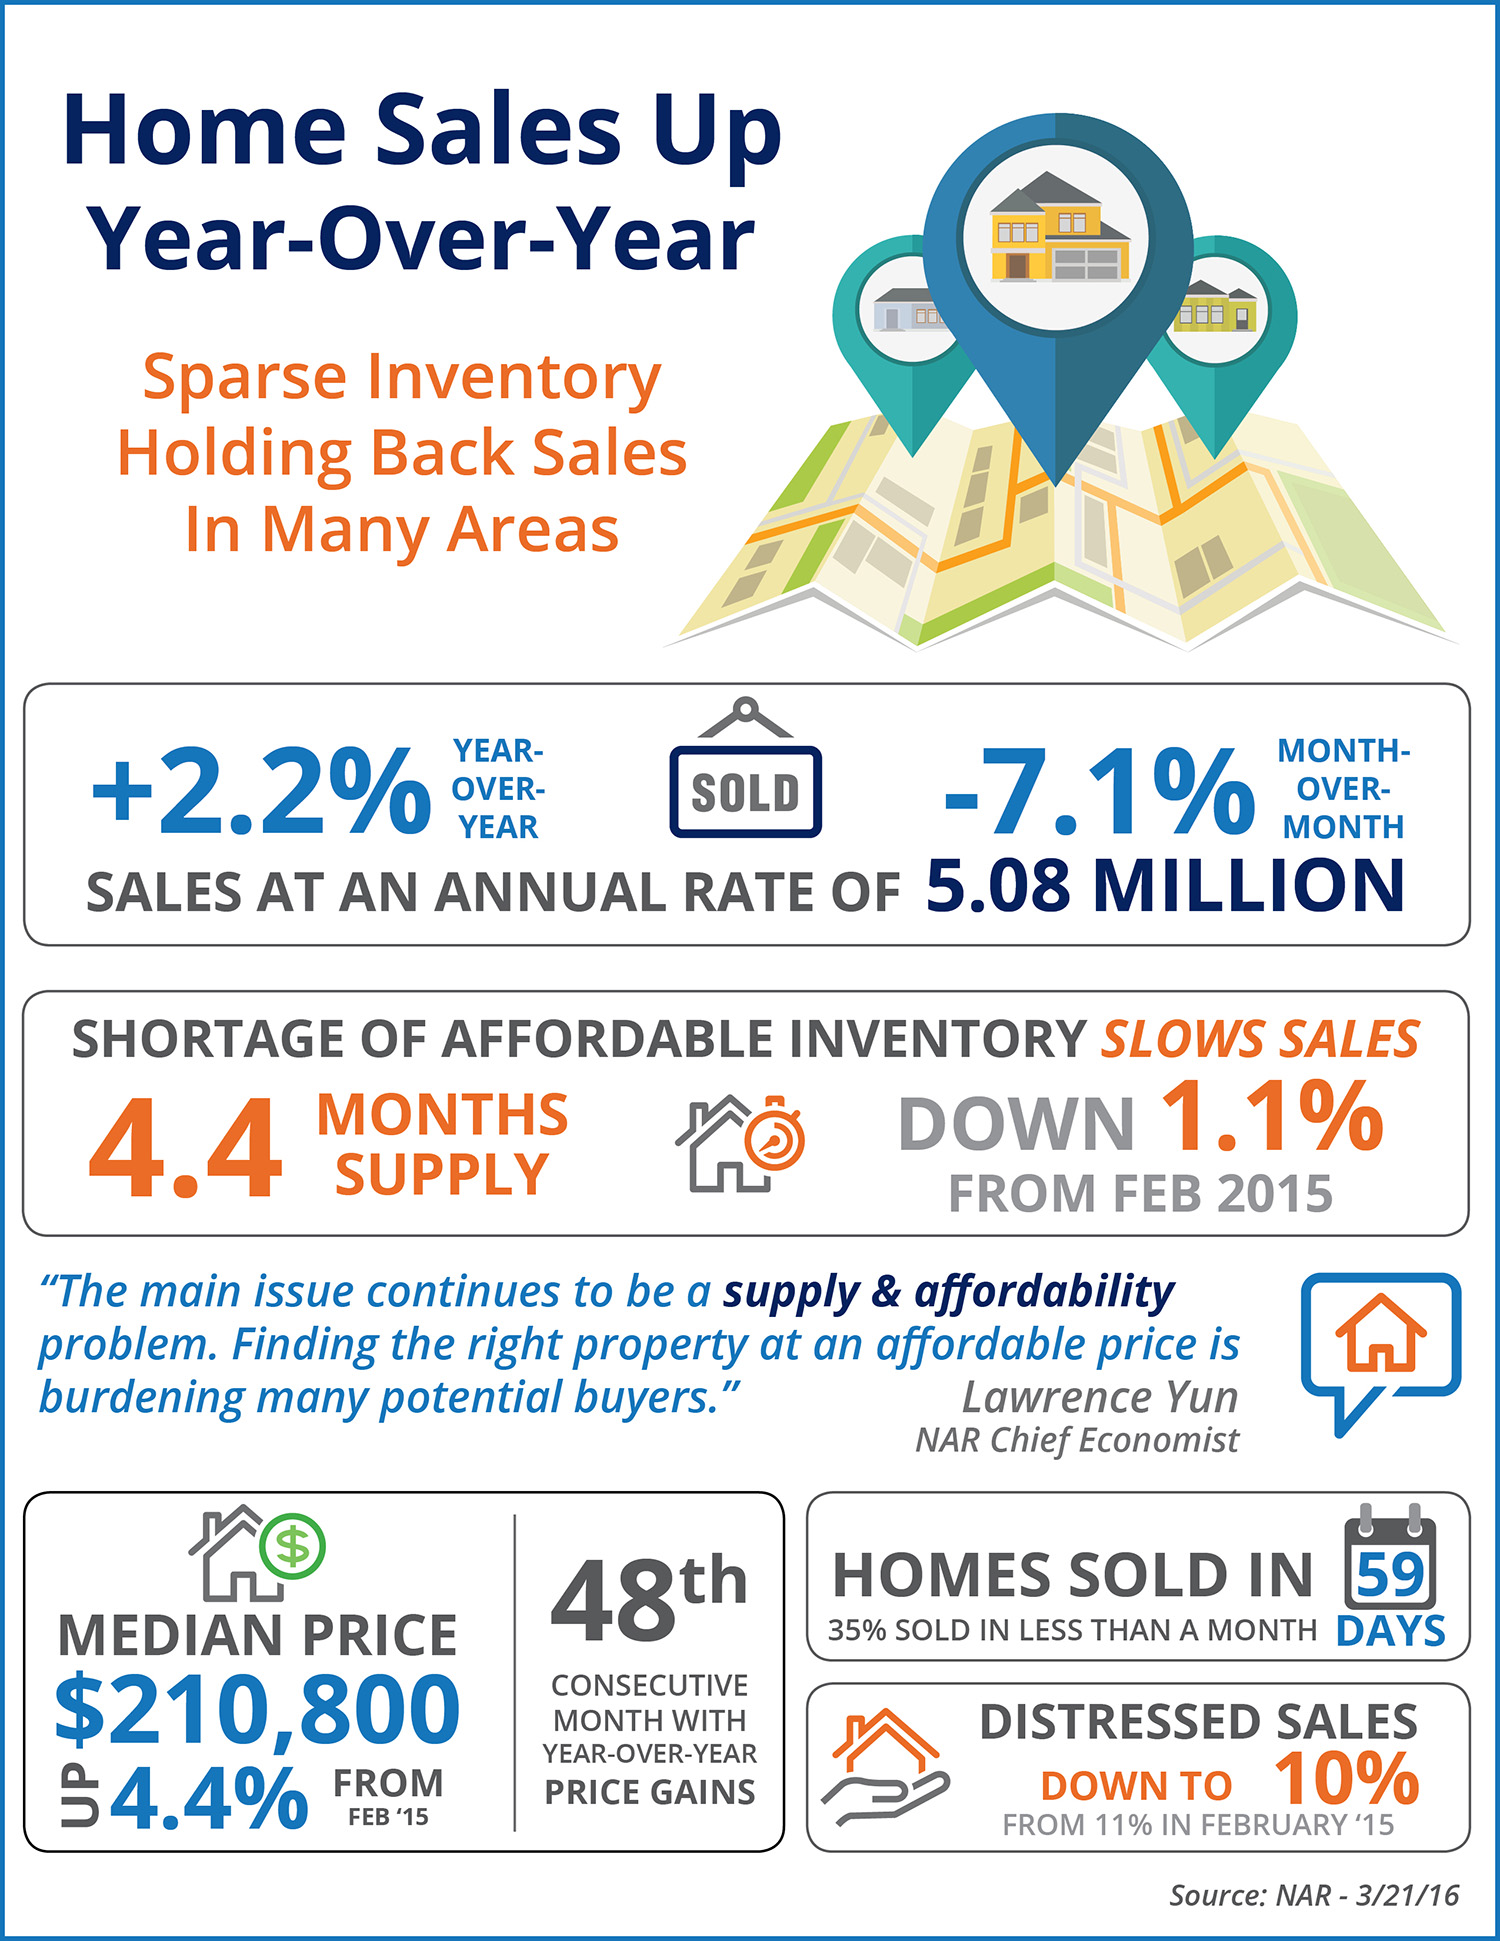
![Exising Home Sales Inch Up In January [INFOGRAPHIC] | Simplifying The Market](https://files.keepingcurrentmatters.com/wp-content/uploads/2016/02/EHS-FEB-STM.jpg)

![How Do You Know If You've Found Your 'Perfect Match'? [INFOGRAPHIC] | Simplifying The Market](https://files.keepingcurrentmatters.com/wp-content/uploads/2016/02/Perfect-Match-STM.jpg)
![Where Are Americans Moving? [INFOGRAPHIC] | Simplifying The Market](https://files.keepingcurrentmatters.com/wp-content/uploads/2016/02/MovingAcrossAmerica2016-STM.jpg)
![Existing Home Sales Bounce Back [INFOGRAPHIC] | Simplifying The Market](https://files.keepingcurrentmatters.com/wp-content/uploads/2016/01/EHS-JAN-STM.jpg)
![Should I Buy Now Or Wait Until Next Year? [INFOGRAPHIC] | Simplifying The Market](https://files.keepingcurrentmatters.com/wp-content/uploads/2016/01/Cost-of-Waiting-STM.jpg)
![Why Do Americans Consider Moving? [INFOGRAPHIC] | Simplifying The Market](https://files.keepingcurrentmatters.com/wp-content/uploads/2016/01/Why-Americans-Move-STM.jpg)
![Change in Home Sales by Price Range [INFOGRAPHIC] | Simplifying The Market](https://files.keepingcurrentmatters.com/wp-content/uploads/2016/01/Change-in-Home-Sales-STM.jpg)
