Home Equity Increasing as Home Prices Rise [INFOGRAPHIC]
![Home Equity Increasing as Prices Rise [INFOGRAPHIC] | Simplifying The Market](https://files.keepingcurrentmatters.com/wp-content/uploads/2015/12/Equity-Infographic-STM1.jpg)
Some Highlights:
- 91.9% of homes in the US have positive equity
- 256,000 homes regained equity in the third quarter of 2015
- 37.5 million homes have significant equity (defined as more than 20%)
Foreclosure Inventory Drops As Economy Improves [INFOGRAPHIC]
![Foreclosure Inventory Drops As Economy Improves [INFOGRAPHIC] | Simplifying The Market](https://files.keepingcurrentmatters.com/wp-content/uploads/2015/12/Corelogic-Foreclosure-STM.jpg)
Some Highlights:
- Foreclosure Inventory has dropped year-over-year for the last 4 years (48 months).
- Only 3.4% of US homes are in serious delinquency.
- 29 states have a foreclosure inventory rate lower than the national average.
- For more information you can download the full report here
Do You Know The Difference Your Interest Rate Makes? [INFOGRAPHIC]
![Do You Know The Difference Your Interest Rate Makes? [INFOGRAPHIC] | Simplifying The Market](https://files.keepingcurrentmatters.com/wp-content/uploads/2015/12/Cost-of-Interest-STM.jpg)
Some Highlights:
- Interest rates have come a long way in the last 30 years.
- The interest rate you secure directly impacts your monthly payment and the amount of house that you can afford.
- Experts predict that rates will increase by 3/4 a percent over the next 12 months.
- Secure a low rate now to get the most house for your money.
Existing Home Sales Up 3.9% [INFOGRAPHIC]
![Existing Home Sales Up 3.9% [INFOGRAPHIC] | Simplifying The Market](https://files.keepingcurrentmatters.com/wp-content/uploads/2015/11/NAR-EHS-October-STM.jpg)
Some Highlights:
- The annual adjusted sales are currently at a 5.36 million pace.
- 14,684 homes sell every day in the United States.
- October marked the 44th consecutive month of price gains.
Singles Are Falling For Their Dream Home [INFOGRAPHIC]
![Singles Are Falling For Their Dream Home [INFOGRAPHIC] | Simplifying The Market](https://files.keepingcurrentmatters.com/wp-content/uploads/2015/11/Single-Home-Buyers-STM.jpg)
Some Highlights:
- 24% of all recent home buyers were single at the time of purchase
- 47% of single men cite the desire to own a home of their own as the primary reason to buy
- 18% of first-time buyers were single women
Slaying Myths About Buying A Home [INFOGRAPHIC]
![Slaying Myths About Buying A Home [INFOGRAPHIC] | Simplifying The Market](https://files.keepingcurrentmatters.com/wp-content/uploads/2015/11/Slaying-Myths-STM.jpg)
Some Highlights:
- Interest Rates are still below historic numbers.
- 88% of property managers raised their rent in the last 12 months!
- Credit score requirements to be approved for a mortgage continue to fall. The 723 average score is the lowest since Ellie Mae began reporting on scores in August 2011.
- The average first-time home buyer down payment was 6% in 2015 according to NAR.
Fannie Mae's Housing Forecast [INFOGRAPHIC]
![Fannie Mae Housing Market Forecast [INFOGRAPHIC] | Simplifying The Market](https://files.keepingcurrentmatters.com/wp-content/uploads/2015/11/Fannie-Mae-Housing-Market-STM.jpg)
Some Highlights:
- 30-year fixed mortgage rates are projected to increase steadily over the next year.
- Housing Starts will well surpass 2015 numbers.
- Home Sales will reach an annual rate of over 6 million by the fourth quarter of 2016.
The Difference An Hour Can Make [INFOGRAPHIC]
![The Difference an Hour Can Make [INFOGRAPHIC] | Simplifying The Market](https://files.keepingcurrentmatters.com/wp-content/uploads/2015/10/The-Difference-an-Hour-Can-Make-STM.jpg)
Every Hour in the US Housing Market:
- 634 Homes Sell
- 347 Homes Regain Positive Equity
- Median Home Values Go Up $1.46
Buying A Home Can Be SCARY... Until You Know The FACTS! [INFOGRAPHIC]
![Buying A Home Can Be SCARY... Until You Know The FACTS! [INFOGRAPHIC] | Simplifying The Market](https://files.keepingcurrentmatters.com/wp-content/uploads/2015/10/Mythbusters-STM.jpg)
Some Highlights:
- 36% of Americans think they need a 20% down payment to buy a home. 44% of Millennials who purchased a home this year have put down less than 10%.
- 71% of loan applications were approved last month
- The average credit score of approved loans was 723 in September (the lowest recorded score since Ellie Mae began tracking in August 2011).
Where Will Home Prices Be Next Year? [INFOGRAPHIC]
![Where Will Home Prices Be Next Year? [INFOGRAPHIC] | Simplifying The Market](https://files.keepingcurrentmatters.com/wp-content/uploads/2015/10/Home-Prices-STM.jpg)
Some interesting facts:
- 25 states are forecasted to achieve higher levels of appreciation in the next 12 months than already achieved in the last year.
- 25 state and the District of Columbia are forecasted to experience a slow in appreciation.
- All 50 states & D.C. are forecasted to achieve some level of positive price appreciation.
Even though each state is appreciating at different levels, you need to know the Cost of Waiting until next year to buy your dream home!
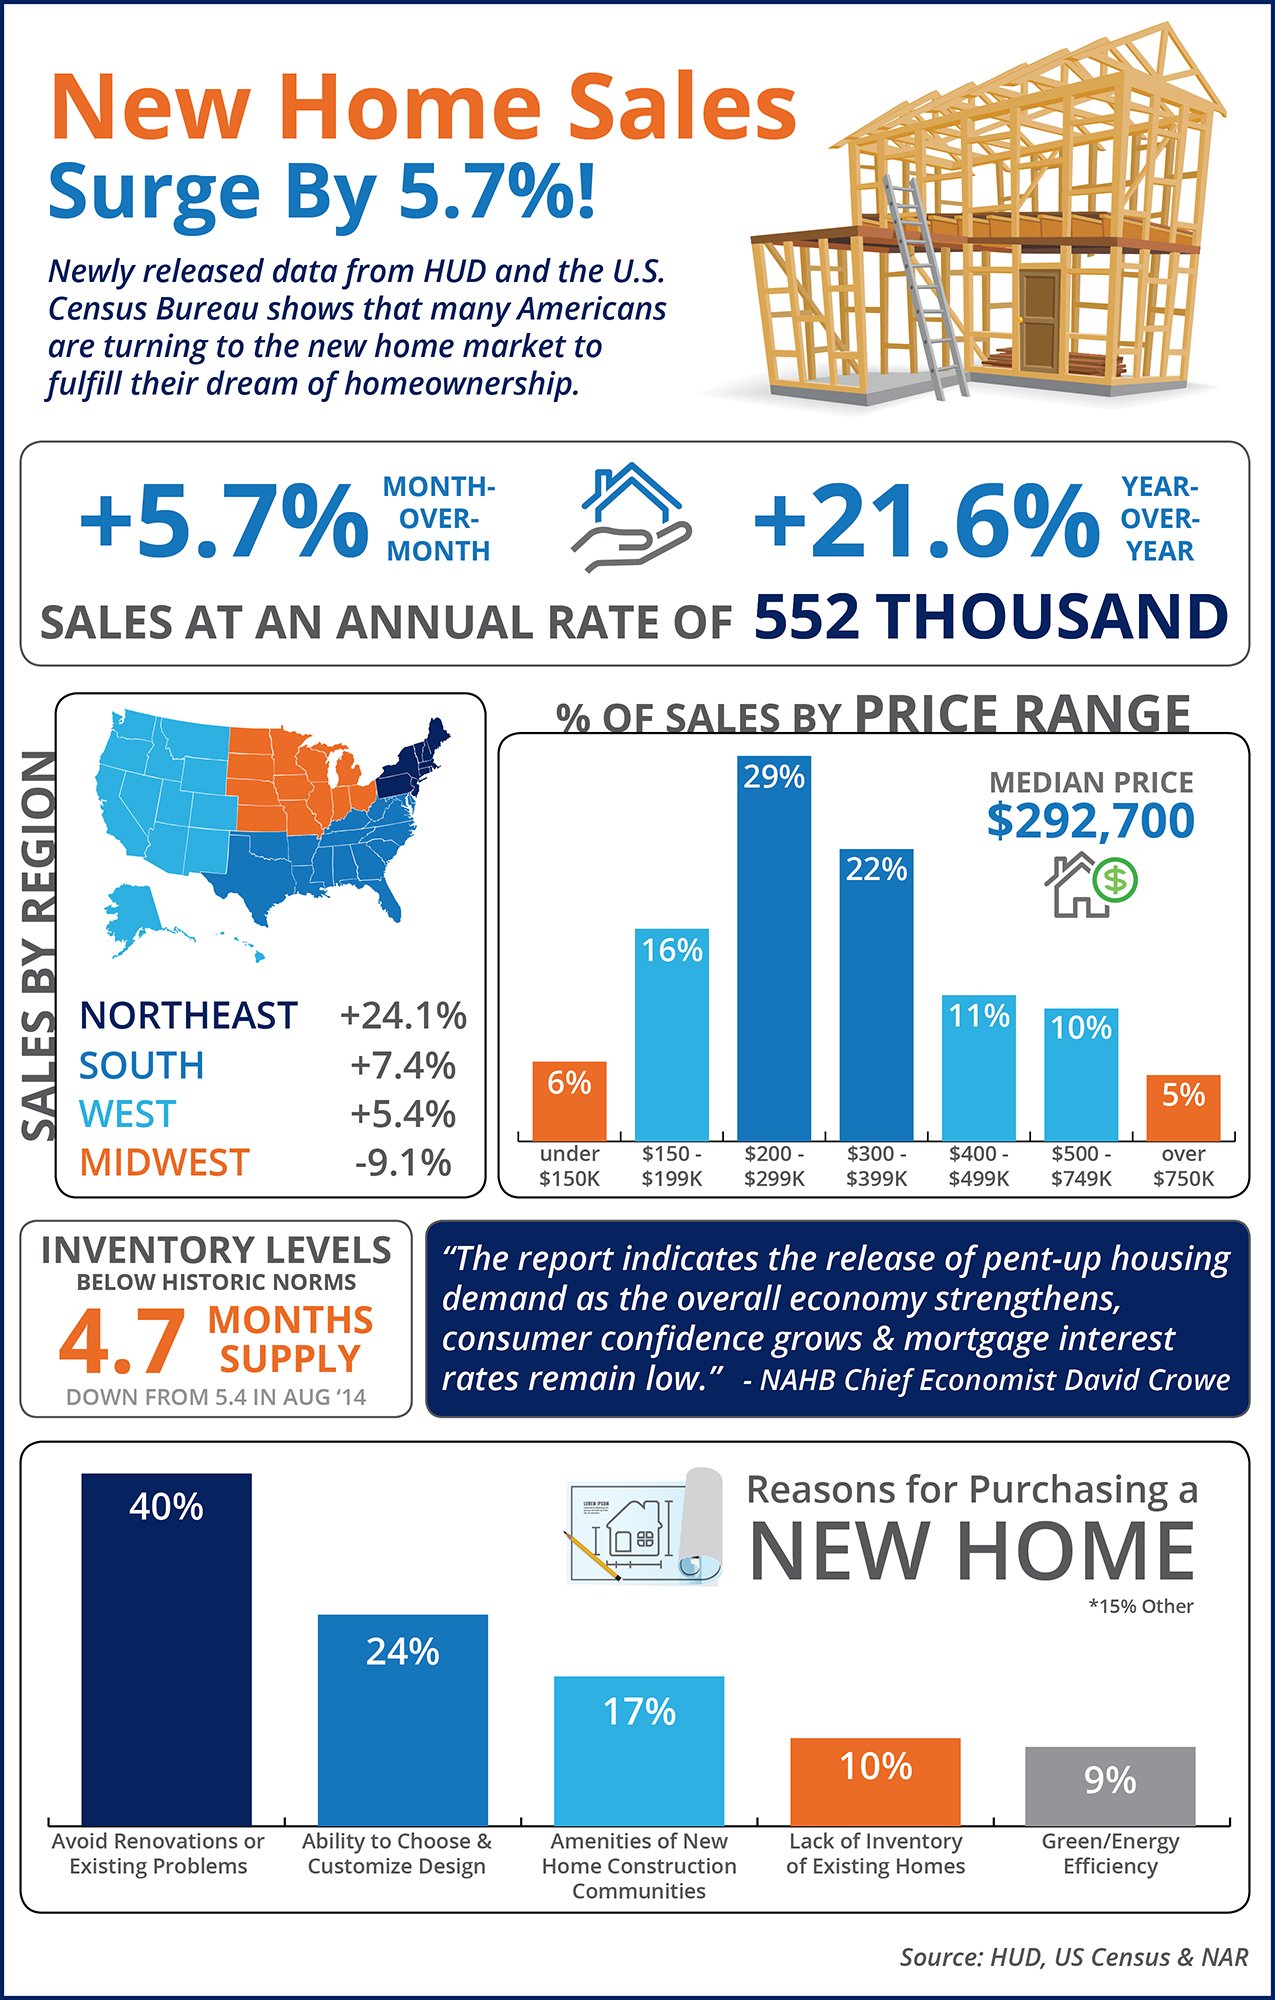
New Home Sales Surge By 5.7%! [INFOGRAPHIC]

Some Highlights:
- The median price of a newly constructed home is currently $292,700.
- Sales are up 5.7% month-over-month and 21.6% year-over-year.
- Many buyers are looking to new homes as an option due to the lack of inventory of existing homes for sale.
How Quickly Are Homes Selling In Your State? [INFOGRAPHIC]
![How Quickly Are Homes Selling In Your State? [INFOGRAPHIC] | Simplifying The Market](https://files.keepingcurrentmatters.com/wp-content/uploads/2015/09/20151002-Days-on-the-Market-STM.jpg)
Some Highlights:
- The National Association of REALTORS® surveyed their members for their Confidence Index
- The REALTORS® Confidence Index is a key indicator of housing market strength based on a monthly survey sent to over 50,000 real estate practitioners. Practitioners are asked about their expectations for home sales, prices and market conditions.
- Homes sold in less than 60 days in 39 out of 50 states and Washington D.C.
- Only Vermont had a median sold date longer than 90 days.
Existing Home Sales Slow Amongst Tight Inventory [INFOGRAPHIC]
![Existing Home Sales Slow Amongst Tight Inventory [INFOGRAPHIC] | Simplifying The Market](https://files.keepingcurrentmatters.com/wp-content/uploads/2015/09/EHS-SEP-STM.jpg)
Some Highlights:
- Existing Home Sales slowed down slightly in August but remained 6.2% higher than August 2014.
- Inventory levels remain below the 6 months necessary for a normal market at a 5.2-month supply.
- First Time Buyers rebounded in August to make up 32% of sales, matching a 2015 high.
Credit Score Requirements LOWER As Interest Rates CREEP UP! [INFOGRAPHIC]
![Credit Score Requirements LOWER As Interest Rates CREEP UP! [INFOGRAPHIC] | Simplifying The Market](https://files.keepingcurrentmatters.com/wp-content/uploads/2015/09/Credit-Needed-STM.jpg)
Some Highlights:
- The average 30-year rate for all loans closed in August eclipsed 4.3% for the first time since October 2014.
- The average FICO score for all closed loans in August reached a new yearly low at 724 (the lowest since February 2014!)
- The average down payment of FHA loans closed was just 4%!
Economic Impact of Every Home Sold [INFOGRAPHIC]
![Economic Impact of Every Home Sold [INFOGRAPHIC] | Simplifying The Market](https://files.keepingcurrentmatters.com/wp-content/uploads/2015/09/Economic-Impact-STM.jpg)
Some Highlights:
- Every time a home is sold, the surrounding economy feels a boost.
- Different industries and businesses benefit at each stage of the process of moving into a home!
- Hawaii leads the way with a $177,000 boost to the local economy.
A+ Reasons to Hire A Real Estate Professional [INFOGRAPHIC]
![A+ Reasons To Hire A Real Estate Professional [INFOGRAPHIC] | Simplifying The Market](https://files.keepingcurrentmatters.com/wp-content/uploads/2015/08/A-Reasons-To-Use-A-RE-Pro-STM.jpg)
Some Highlights:
- Hiring a Real Estate Professional to buy your dream home, or sell your current house is one of the most 'educated' decisions you can make!
- A Real Estate Professional has the experience needed to help you through the entire process.
- Make sure that you hire someone who knows current market conditions & can simply & effectively explain them to you & your family!
NAR'S Latest Existing Home Sales Report [INFOGRAPHIC]
Some Highlights:
- Existing Home Sales are up 10.3% year-over-year across the country.
- Sales rose to an annual rate of 5.59 million marking the 10th month in a row of year-over-year gains
- Prices are up 5.6% year-over-year in the U.S. to a median price of $234,000
- Marked the 41st consecutive month of year-over year price gains.

![NAR's Latest Existing Home Sales Report [INFOGRAPHIC] | Simplifying The Market](https://files.keepingcurrentmatters.com/wp-content/uploads/2015/12/Slide21.jpg)
![NAR'S Latest Existing Home Sales Report [INFOGRAPHIC] | Simplifying The Market](https://files.keepingcurrentmatters.com/wp-content/uploads/2015/08/EHS-20150828.jpg)
![Home Prices Up in 93% of Measurable Markets [INFOGRAPHIC] | Simplifying The Market](https://files.keepingcurrentmatters.com/wp-content/uploads/2015/08/20150821-Metro-Prices-Graph-STM.jpg)
![Foreclosure Inventory Hits Lowest Mark in Over 7 Years [INFOGRAPHIC] | Simplifying The Market](https://files.keepingcurrentmatters.com/wp-content/uploads/2015/08/Corelogic-Foreclosure-STM.jpg)

![Spring Buying Season Extends Into Summer [INFOGRAPHIC] | Simplifying The Market](https://files.keepingcurrentmatters.com/wp-content/uploads/2015/07/EHS-JULY-STM.jpg)
![Cost Across Time [INFOGRAPHIC] | Simplifying The Market](https://files.keepingcurrentmatters.com/wp-content/uploads/2015/07/20150724-Cost-Across-Time-STM.jpg)
![45% of Homes Sold in Less Than A Month! [INFOGRAPHIC] | Simplifying The Market](https://files.keepingcurrentmatters.com/wp-content/uploads/2015/07/Days-on-the-Market-STM.jpg)
![Boomerang Buyers Coming Back in Force [INFOGRAPHIC] | Simplifying The Market](https://files.keepingcurrentmatters.com/wp-content/uploads/2015/07/Boomerang-STM.jpg)
